Comparing health care spending across developed countries is a complex, often oversimplified task, and the opportunities to learn from such comparisons are limited. This brief, one in a series of papers intended to define the key drivers in health care spending, highlights tensions related to decreasing spending and the limited utility of international comparisons of health care spending.
The U.S. Spends a Lot ... on Many Things
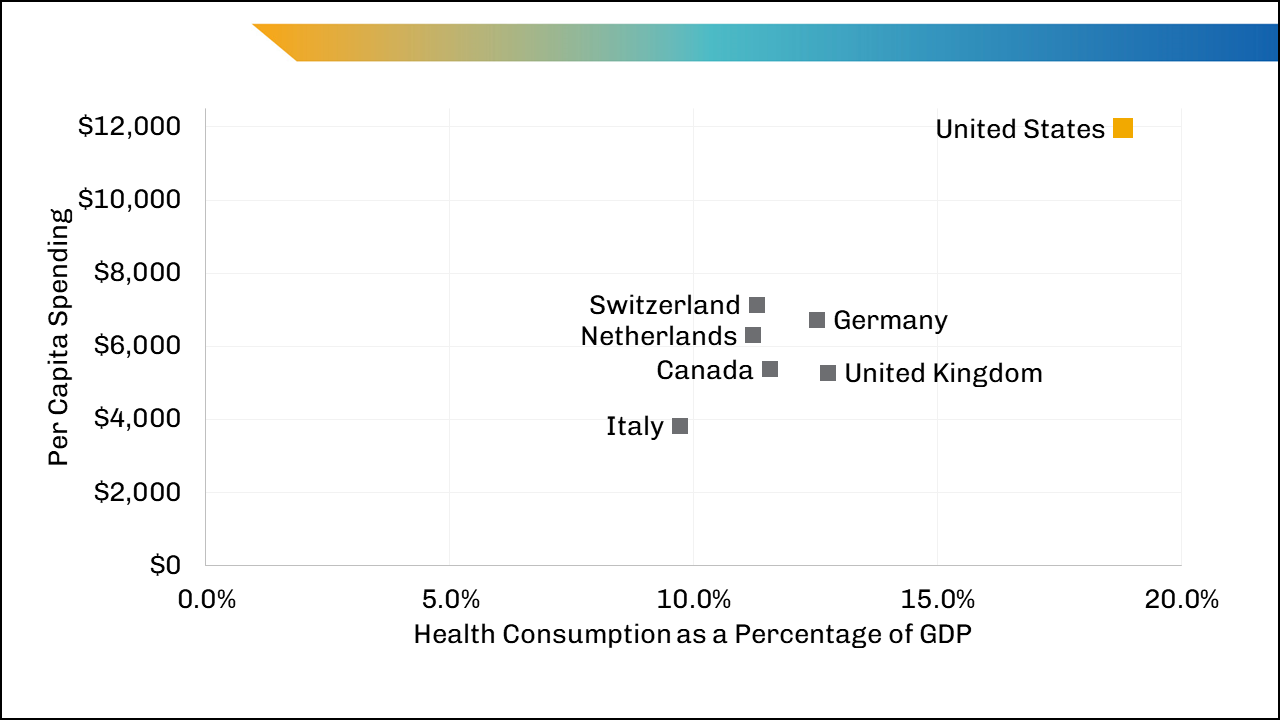
U.S. health care spending, both as a percentage of gross domestic product (GDP) and per capita, is the highest in the world, as it has been for the past 20 years. In 2020, nearly a fifth (18.8%) of the country’s GDP went toward health consumption spending (i.e., costs from personal health care such as hospital care, physician and clinical services, and prescription drugs; these costs exclude spending for research and equipment and make up 95% of total health care spending) and reached $11,945 per capita (Figure 1).1

Comparing overall spending as a percentage of GDP (or as per capita spending) is frequently done to highlight the variation in spending across countries but without identifying the context or causes of that variation. Authors often present higher U.S. spending overall as de facto evidence of waste without placing it in the context of the U.S. economy as a whole or examining the reasons behind the higher costs. Consider this comparison: In 2020, U.S. military spending as a percentage of GDP was 50% higher than the Organization for Economic Cooperation and Development (OECD) average (3.7% vs. 2.5%),2 yet those numbers by themselves tell us very little. Similarly, in 2017, OECD members spent 3.5 times the U.S. level of public spending for families as a percentage of GDP (2.1% vs. 0.6%),3 which also tells us very little.
U.S. Health Care Is Composed of Multiple Financing Systems
U.S. health care financing is a mix of public and private insurers (payers) and providers operating independently or within multiple heterogeneous systems. Public health insurance (i.e., Medicare and Medicaid), established in the 1960s, was intended primarily as coverage for hospital care for elderly people, people with disabilities, and poor people.4 In 2020, more than half (59%) of the nonelderly U.S. population was insured by private insurance obtained through employers, and about 6% was covered through individually purchased plans, predominantly through the Affordable Care Act Marketplace.5
The United States is the only developed country that does not provide a basic health care plan to all residents.6 As a result, more than 27 million nonelderly people (10% of the nonelderly population) remained uninsured in 2020,7 and that lack of insurance coverage affects the costs of health services for everyone (discussed in other papers in this series). Traditional Medicare coverage resembles some other countries’ single-payer systems, but it operates within a large private system and pays only for coverage for adults aged 65 and older and people with disabilities or specific conditions.
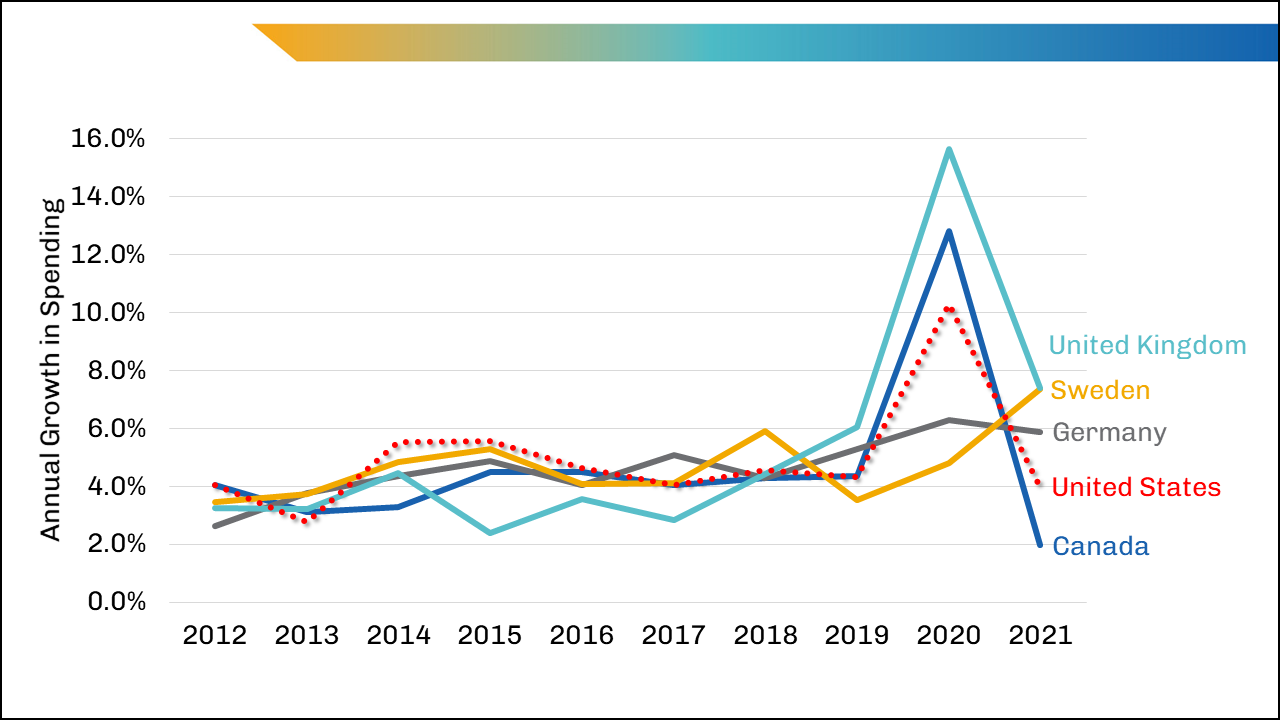
Given the multiple financing systems in the United States, it should not be a surprise to see higher spending amounts (discussed later in this paper) compared with similar countries. And while the United States spends considerably more than other countries on health care, the growth in spending from year to year has remained in line with other similar countries (Figure 2).

Less on Health, More on Care — Despite Greater Basic Needs
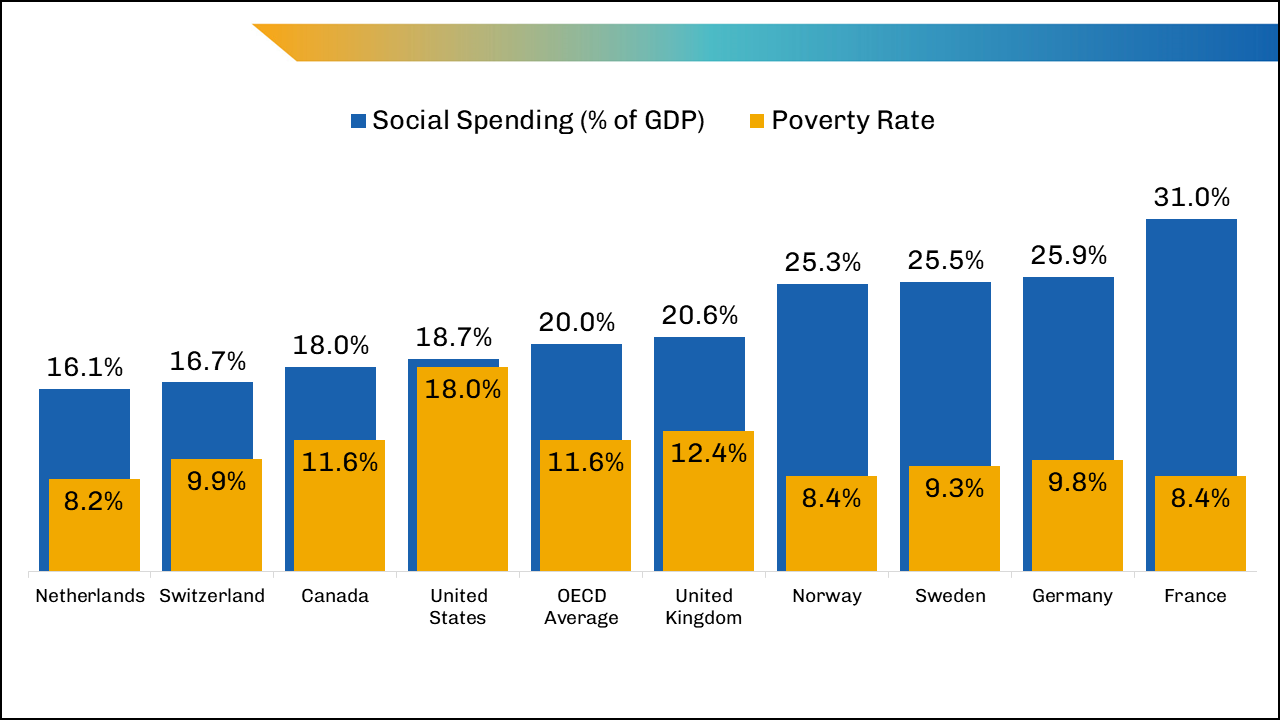
The United States spends most of its health care dollars on clinical services, and it spends less on social services as a percentage of GDP than other developed countries do. The relatively lower spending on social services, which affects social determinants of health, contributes to many of the poorer health-related outcomes in the United States, such as life expectancy at birth.8-10 In 2019, the United States spent 18.7% of GDP on public social spending,11 less than the average of all OECD countries (20.0%) and far less than countries such as France and Germany (Figure 3).

The need for social services spending is higher in the United States than in other developed countries because of the higher percentage of people living in poverty (which negatively affects health): 18.0% of people in the United States were living below the poverty level in 2019 (the second highest rate of all OECD countries after Costa Rica) compared with 12.4% in the United Kingdom and 8.4% in France.12 Comparing average incomes can obscure the extent of poverty; on average, U.S. residents out-earn most other countries. However, the United States also had the highest share of workers earning less than two-thirds of median earnings in 2020: nearly a quarter of the U.S. population (24%) compared with the OECD average of 14%.13
Higher Costs Tied to Higher Wages and Administrative Costs
In addition to the glaring differences between the health and financial systems across developed countries, there are differences in labor and administrative costs. More than half of U.S. inpatient hospital costs are for wages and benefits.14 Data about total wages in health care are limited, but a review of 2019 or 2020 tax documents for 30 large and financially well-performing health systems across the United States found the wages (excluding benefits) of employees account for an average of 39% of the systems’ total spending. For some health systems, that percentage is much larger, up to 59%. These estimates do not include the wages of physicians not directly employed by a health system, so the values are likely underestimates of true labor costs.
According to our review of those 30 U.S. health systems, the estimate for total wages in 2020 ranged between $0.9 and $2.3 trillion — and was most likely close to $1.5 trillion (39% of total health care spending). In another analysis of fiscal year (FY) 2019 Medicare spending data from 258 hospitals across the United States, wages accounted for 38% of hospital spending and ranged from 14% to 91%.15 In 2019, the share of total reported health spending that went toward wages in Italy and the Netherlands was 31% and 69%, respectively, and in 2018 in the United Kingdom, that value was 46%.16
Altering the labor component of health care costs in the U.S. economy has not been a focus in federal policy, and it probably should not be. If the labor costs of all employees in the U.S. health sector were reduced to the 31% share of health spending attributable to wages in Italy, the United States would save $300 billion (assuming 39% of U.S. health spending is currently attributable to labor). The loss of income to much of the health care labor force would likely cause further attrition and workforce shortages at a time when clinical personnel are already in short supply.17 Reducing labor costs is unrealistic in the near term, because hospitals alone have reported a 37% increase in labor costs in the past two years and an increase of more than 100% in contract nurses’ median hourly wages.18
Although total wages for physicians amount to a very large number in the United States, their pay accounts for a small percentage of total health care spending. According to an analysis using Medscape’s average physician salary, OECD's 2019 number of U.S. practicing physicians, and CMS 2020 National Health Expenditures data, physician income made up only 7% of total health expenditures in 2020.1,19,20
The high estimated administrative costs in the United States consistently stand out in worldwide comparisons. By one estimate, these costs totaled $765 billion in 2018.21 They are the nonclinical costs of running a health care practice or system, including billing, insurance, marketing, enrollment, and quality measurement.21 However, administrative costs also capture the costs associated with allowing patients to choose their providers and insurers (e.g., marketing costs for plans and providers).22 In theory, the U.S. system is based on choice and competition, where all entities (insurers, providers, employers, and patients) make choices about whom to accept and cover and where to enroll.
Due to the complexity of the large private insurance market, we expect administrative costs in the United States to be higher than in other developed countries, though research has suggested that select administrative costs are “excessive.”23-25 Not surprisingly, researchers have also found that countries with single-payer health systems such as Canada spend considerably less on administrative costs than the United States.26,27
Billing and insurance-related costs make up a large share of the total administrative costs, and while billing and payment for services are necessary in a fee-for-service environment, research has suggested that introducing standardized billing and claims across insurers, simplifying prior authorizations, and improving data accessibility across providers within health systems could result in substantial decreases in costs.23,25,27-29
Limiting the Growth in U.S. Health Care Spending Is Not a Quick Process
While some health policy changes in the past century have slowed growth in health care spending, none have reduced total costs of health care. International comparisons help highlight the issue of higher costs in the United States and keep the discussion of costs on the policy agenda, but they are not useful in illuminating next steps for reducing growth in spending from year to year. Policymakers would be wise to look for incremental steps toward reducing spending growth, at least until the political will for a sweeping system change becomes a serious possibility.
Most people would probably agree that eliminating some of the administrative processes that result in the need for many nonclinical positions per clinician is a reasonable goal. A critical examination of administrative processes that do not add value or control unnecessary clinical spending, such as claims, billing, and prior authorizations, would be beneficial, as could increasing the wages of the lowest-paid health care workers (e.g., aides and assistants) to meet clinical demand.
While the United States will not mirror the health care financing arrangements of other countries in the coming decade, it does have opportunities to control costs. Reducing the growth in nonlabor costs — of supplies, drugs, and administration — may be possible with carefully crafted incremental policies.
As policymakers and others discuss reforms for controlling costs in the U.S. health care system, it is time to set aside the international comparisons of differing health systems, populations, and environments and instead focus on where the country can feasibly direct resources within health care to improve outcomes while holding the growth in spending to a minimum.
Notes
- Centers for Medicare & Medicaid Services. National Health Expenditure Data. Dec. 1, 2021. https://www.cms.gov/Research-Statistics-Data-and-Systems/Statistics-Trends-and-Reports/NationalHealthExpendData/NHE-Fact-Sheet. Accessed April 24, 2022.
- The World Bank. Military Expenditure (% of GDP) — OECD Members. https://data.worldbank.org/indicator/MS.MIL.XPND.GD.ZS?end=2020&locations=OE&start=2000&view=chart. Accessed April 7, 2022.
- Organisation for Economic Co-operation and Development. Social Expenditure — Aggregated Data. Paris, France: Organisation for Economic Co-operation and Development. https://stats.oecd.org/Index.aspx?datasetcode=SOCX_AGG. Accessed April 7, 2022.
- KFF. History of Health Reform Efforts in the United States. San Francisco, CA: Kaiser Family Foundation; March 25, 2011. https://www.kff.org/health-reform/timeline/history-of-health-reform-efforts-in-the-united-states/. Accessed May 1, 2022.
- KFF. State Health Facts. Health Insurance Coverage of Nonelderly 0-64 (CPS), 2020. San Francisco, CA: Kaiser Family Foundation; November 2021. https://www.kff.org/other/state-indicator/health-insurance-coverage-of-nonelderly-0-64/. Accessed April 7, 2022.
- The Commonwealth Fund. International Health Care System Profiles. https://www.commonwealthfund.org/international-health-policy-center/system-profiles. Published December 2020. Accessed April 21, 2022.
- Tolbert J, Orgera K, Damico A. What Does the CPS Tell Us About Health Insurance Coverage in 2020? San Francisco, CA: KFF; Sept. 23, 2021. https://www.kff.org/uninsured/issue-brief/what-does-the-cps-tell-us-about-health-insurance-coverage-in-2020/. Accessed April 21, 2022.
- Woolf S, Masters R, Aron L. Changes in life expectancy between 2019 and 2020 in the US and 21 peer countries. JAMA Netw Open. 2022;5(4):e227067. doi:10.1001/jamanetworkopen.2022.7067.
- Bradley E, Canavan M, Rogan E, et al. variation in health outcomes: the role of spending on social services, public health, and health care, 2000-09. Health Affairs. 2016;35:760-769. https://www.healthaffairs.org/doi/full/10.1377/hlthaff.2015.0814.
- “Public social spending” refers to social benefits paid by general government funds. In the United States, these include the Supplemental Nutrition Assistance Program (SNAP), Supplemental Security Income (SSI), Temporary Assistance for Needy Families (TANF), the Special Supplemental Nutrition Program for Women, Infants, and Children (WIC), Medicaid, and Medicare.
- Organisation for Economic Co-operation and Development. Social Expenditure (indicator). doi:10.1787/7497563b-en. Accessed March 25, 2022.
- Organisation for Economic Co-operation and Development. Income Distribution Database by Country — Poverty, 2019. Paris, France: Organisation for Economic Co-operation and Development; 2019. https://stats.oecd.org/index.aspx?queryid=66670#. Accessed April 7, 2022.
- Organisation for Economic Co-operation and Development. Average Wages (indicator). doi:10.1787/cc3e1387-en. Accessed April 7, 2022.
- American Hospital Association. Cost of Caring. Washington, DC: AHA; October 2021. https://www.aha.org/guidesreports/2021-10-25-cost-caring. Published October 2021. Accessed April 7, 2022.
- AAMC analysis of FY 2019 Medicare cost-report data, Healthcare Cost Report Information System (HCRIS) July 2021 release. If FY 2019 cost-report data weren't available, FY 2018 data were used. AAMC membership as of October 2021.
- World Health Organization, Regional Office for Europe, European Health Information Gateway. Salaries as % of total public health expenditure. https://gateway.euro.who.int/en/indicators/hfa_582-6810-salaries-as-of-total-public-health-expenditure/. Accessed April 20, 2022.
- Ollove M. Health Worker Shortage Forces States to Scramble. March 25, 2022. Pew Charitable Trusts: Stateline. https://www.pewtrusts.org/en/research-and-analysis/blogs/stateline/2022/03/25/health-worker-shortage-forces-states-to-scramble. Accessed April 25, 2022.
- Mensik H. Hospital labor expenses up 37% from pre-pandemic levels in March. Healthcare Dive. May 12, 2022. https://www.healthcaredive.com/news/kaufman-hall-hospital-labor-costs-travel-nurse-pay/623655/?utm_medium=email&utm_source=rasa_io. Accessed May 12, 2022.
- Kane L, Schubsky B. International Physician Compensation Report 2021: Do US Doctors Have It Better? Medscape. August 20, 2021. https://www.medscape.com/slideshow/2021-international-compensation-report-6014239#1. Accessed April 7, 2022.
- Organisation for Economic Co-operation and Development. Health Care Resources, Practising Physicians. Paris, France: Organisation for Economic Co-operation and Development. https://stats.oecd.org/index.aspx?queryid=30025. Accessed April 7, 2022.
- Papanicolas I, Woskie LR, Jha AK. Health care spending in the United States and other high-income countries. JAMA. 2018;319(10):1024-1039. doi:10.1001/jama.2018.1150.
- Chernew M, Mintz H. Administrative expenses in the US health care system: why so high? JAMA. 2021;326(17):1679-1680. doi:10.1001/jama.2021.17318
- Gee E, Spiro T. Excess Administrative Costs Burden the U.S. Health Care System. Washington, DC: Center for American Progress; April 8, 2019. https://www.americanprogress.org/article/excess-administrative-costs-burden-u-s-health-care-system/. Accessed April 7, 2022.
- Organisation for Economic Co-operation and Development. Tackling Wasteful Spending on Health. Paris, France: Organisation for Economic Co-operation and Development; Jan. 10, 2017. https://doi.org/10.1787/9789264266414-en. Accessed April 7, 2022.
- Tollen L, Keating E, Weil A. How administrative spending contributes to excess US health spending. Health Affairs Blog. Feb. 20, 2020. doi:10.1377/hblog20200218.375060.
- Himmelstein DU, Campbell T, Woolhandler S. Health care administrative costs in the United States and Canada, 2017. Ann Intern Med. 2020;172(2):134-142. doi:10.7326/M19-2818. Epub 2020, Jan. 7. Erratum in: Ann Intern Med. 2020;173(5):415. PMID: 31905376.
- Himmelstein DU, Jun M, Busse R, et al. A comparison of hospital administrative costs in eight nations: US costs exceed all others by far. Health Affairs. 2014;33:9. https://doi.org/10.1377/hlthaff.2013.1327.
- Cutler D. Reducing Administrative Costs in U.S. Health Care. Washington, DC: The Hamilton Project. https://www.hamiltonproject.org/papers/reducing_administrative_costs_in_u.s_health_care. Published March 10, 2020.
- Shrank WH, Rogstad TL, Parekh N. Waste in the US health care system: estimated costs and potential for savings. JAMA. 2019;322(15):1501-1509. doi:10.1001/jama.2019.13978.


