The gap in life expectancy between the United States and its peer nations has grown over the last two decades. The most recent life expectancy at birth (2022) in the United States (77.6 years) was among the lowest life expectancies found among all Organization for Economic Cooperation and Development (OECD) countries (the average was 80.6 years).1 Many authors have focused on the United States’ disproportionately high spending on health care, suggesting that life expectancy should be higher in this country as a result;2 3 4 however, both clinical and nonclinical factors, including certain public health investments and social and economic factors, are strongly correlated with decreases in longevity.5 6 7
- OECD. Life expectancy at birth. In: Health at a Glance 2023: OECD Indicators. OECD Publishing; 2023. doi:10.1787/d90b402d-en Back to text ↑
- Blumenthal D. Drop in U.S. life expectancy is an ‘indictment of the American health care system.’ STAT. January 4, 2018. Accessed September 13, 2024. https://www.statnews.com/2018/01/04/life-expectancy-us-health-care/ Back to text ↑
- Cohen JP. Dismal U.S. life expectancy trend reflects disconnect between dollars spent on healthcare and value produced. Forbes. November 1, 2020. Accessed September 13, 2024. https://www.forbes.com/sites/joshuacohen/2020/11/01/dismal-us-life-expectancy-trend-reflects-disconnect-between-dollars-spent-on-healthcare-and-value-produced/ Back to text ↑
- Howard J. US spends most on health care but has worst health outcomes among high-income countries, new report finds. CNN Health. January 31, 2023. Accessed September 13, 2024. https://www.cnn.com/2023/01/31/health/us-health-care-spending-global-perspective/index.html Back to text ↑
- Galvani-Townsend S, Martinez I, Pandey A. Is life expectancy higher in countries and territories with publicly funded health care? Global analysis of health care access and the social determinants of health. J Glob Health. 2022;12:04091. doi:10.7189/jogh.12.04091 Back to text ↑
- Singh GK, Daus GP, Allender M, et al. Social Determinants of Health in the United States: Addressing Major Health Inequality Trends for the Nation, 1935-2016. Int J MCH AIDS. 2017;6(2):139-164. doi:10.21106/ijma.236 Back to text ↑
- Bundy JD, Mills KT, He H, et al. Social determinants of health and premature death among adults in the USA from 1999 to 2018: a national cohort study. Lancet Public Health. 2023;8(6):e422-e431. doi:10.1016/S2468-2667(23)00081-6 Back to text ↑
While the life expectancy in the United States is an outlier among high-income countries, it is also an outlier in other ways that affect longevity. This snapshot examines the impact on life expectancy from three common, preventable causes of death in the United States: alcohol, drugs, and firearms.
In 2022, there were more than 48,000 firearm-related deaths (more than half were recorded as suicides, according to a forthcoming analysis by the AAMC Research and Action Institute); nearly 108,000 drug-related deaths; and more than 51,000 alcohol-induced deaths.8 While these numbers made up a small fraction of the nearly 3.3 million deaths in 2022 in the United States, they disproportionately affected children and younger adults — and, as a result, lowered the U.S. life expectancy at birth. If these deaths were eliminated (and other causes of death remained the same), life expectancy at birth would increase by 1.6 years.8 This analysis shows how shortened life expectancy is closely related to causes of death that can be lessened through targeted public health interventions and investments in mental health and social services, rather than making direct changes to clinical care. Mental health (including care for substance use disorders) and social services have often been excluded from what health insurers deem medically necessary,9 and thus have evolved separately from the core clinical care system in the United States. Life expectancy is heavily influenced by these traditionally nonclinical services, making it a potentially less useful measurement of clinical health care delivery outcomes in this country.10
- CDC, National Center for Health Statistics. CDC Wonder. Underlying cause of death, 2018-2022, single race request. Accessed September 16, 2024. http://wonder.cdc.gov/ucd-icd10-expanded.html Back to text ↑
- Rapfogel N. The Behavioral Health Care Affordability Problem. Center for American Progress; 2022. Accessed September 13, 2024. https://www.americanprogress.org/article/the-behavioral-health-care-affordability-problem/ Back to text ↑
- County Health Rankings & Roadmaps. What impacts health. Accessed September 13, 2024. https://www.countyhealthrankings.org/what-impacts-health/county-health-rankings-model Back to text ↑
In recent years, lower life expectancy in the United States has been commonly linked to COVID-19, unintentional injuries, heart disease, drug overdoses, and suicides.11 12 13 Life expectancy also correlates strongly with demographics, locations, and social and economic factors.14 15 People in southern states generally experience lower life expectancies than those in other regions of the country, with nine of the lowest state life expectancies in 2020 being in the southeast region.16 People with lower incomes also tend to have lower life expectancies than those with higher incomes, a trend that has been consistent over the years.17 Other factors, including access to education, lifestyle, environment, and genetic predisposition to disease, also play roles in measuring life expectancy in the United States.16 18
- Klobucista C. U.S. life expectancy is in decline. Why aren’t other countries suffering the same problem? Council on Foreign Relations. Published September 8, 2022. Accessed September 13, 2024. https://www.cfr.org/in-brief/us-life-expectancy-decline-why-arent-other-countries-suffering-same-problem Back to text ↑
- Institute of Medicine and National Research Council. U.S. Health in International Perspective: Shorter Lives, Poorer Health. The National Academies Press; 2023. doi:10.17226/13497 Back to text ↑
- Sagna AO, Kemp MLS, DiNitto DM, Choi NG. Impact of suicide mortality on life expectancy in the United States, 2011 and 2015: age and sex decomposition. Public Health. 2020;179:76-83. doi:10.1016/j.puhe.2019.09.024 Back to text ↑
- Radley DC, Williams RD II, Gunja MZ, Baumgartner JC, Gumas ED. Americans, no matter the state they live in, die younger than people in many other countries. The Commonwealth Fund. Published August 11, 2022. Accessed September 16, 2024. https://www.commonwealthfund.org/blog/2022/americans-no-matter-state-they-live-die-younger-people-many-other-countries Back to text ↑
- Avendano M, Kawachi I. Why do Americans have shorter life expectancy and worse health than do people in other high-income countries? Annu Rev Public Health. 2014;35:307-325. doi:10.1146/annurev-publhealth-032013-182411 Back to text ↑
- American life expectancy by state. Keck School of Medicine of the University of Southern. Published November 8, 2023. Accessed September 16, 2024. https://mphdegree.usc.edu/blog/american-life-expectancy-by-state Back to text ↑
- Avanceña ALV, DeLuca EK, Iott B, et al. Income and income inequality are a matter of life and death. What can policymakers do about it? Am J Public Health. 2021;111(8):1404-1408. doi:10.2105/AJPH.2021.306301 Back to text ↑
- University of Florida, Online Graduate Programs in Innovative Aging Studies, Department of Physiology and Aging. Exploring the factors that affect human longevity. Published March 27, 2024. Accessed September 16, 2024. https://online.aging.ufl.edu/2024/03/27/exploring-the-factors-that-affect-human-longevity/ Back to text ↑
Compared to many OECD countries, the United States’ death rates for alcohol, drugs, and firearms have far exceeded other nations, and it consistently has had the highest rate of firearm-related deaths in children and teenagers, over 9.5 times the rate of Canada in 2021.19 Likewise, the United States has had the highest rate of drug-related deaths from commonly misused substances, with over 15 times the rate of Spain in 2021 (Figure 1).20 Prior to 2020, unintentional injuries (e.g., motor vehicle accidents) were the leading causes of death for young people ages 1-19; since 2020, firearms have been the leading cause of death for people ages 1-19. In 2022, drug use (including opioids) was the leading cause of death for Americans 1-44 years of age; firearms were the third-leading cause of death. The majority of firearm-related deaths in the United States are due to suicide,21 and 54.6% of total suicides in 2022 were by firearms.22 Children and adolescents (ages 1-19) in the United States saw the largest increases, specifically, in firearm-related and drug-related deaths from 2019 to 2022, when firearm-related deaths surpassed deaths from motor vehicle accidents and reached nearly 6 deaths per 100,000 people.8
- McGough M, Amin K, Panchal N, Cox C. Child and teen firearm mortality in the U.S. and peer countries. KFF. Published July 18, 2023. Accessed September 16, 2024. https://www.kff.org/mental-health/issue-brief/child-and-teen-firearm-mortality-in-the-u-s-and-peer-countries/ Back to text ↑
- Institute for Health Metrics and Evaluation, Global Health Data Exchange. Global Burden of Death Study 2021 results. Accessed September 12, 2024. https://vizhub.healthdata.org/gbd-results/ Back to text ↑
- Kelly M. New gun deaths data in U.S. show continued rise in suicides. Harvard Public Health. Published February 1, 2023. Accessed September 16, 2024. https://harvardpublichealth.org/policy-practice/new-gun-deaths-data-in-u-s-show-continued-rise-in-suicides/ Back to text ↑
- CDC, National Center for Health Statistics. CDC Wonder. Underlying cause of death, 2018-2022, single race results. Accessed September 16, 2024. https://wonder.cdc.gov/controller/datarequest/D158;jsessionid=F0871C2DF345A39841B38EB1DC98 Back to text ↑
- CDC, National Center for Health Statistics. CDC Wonder. Underlying cause of death, 2018-2022, single race request. Accessed September 16, 2024. http://wonder.cdc.gov/ucd-icd10-expanded.html Back to text ↑
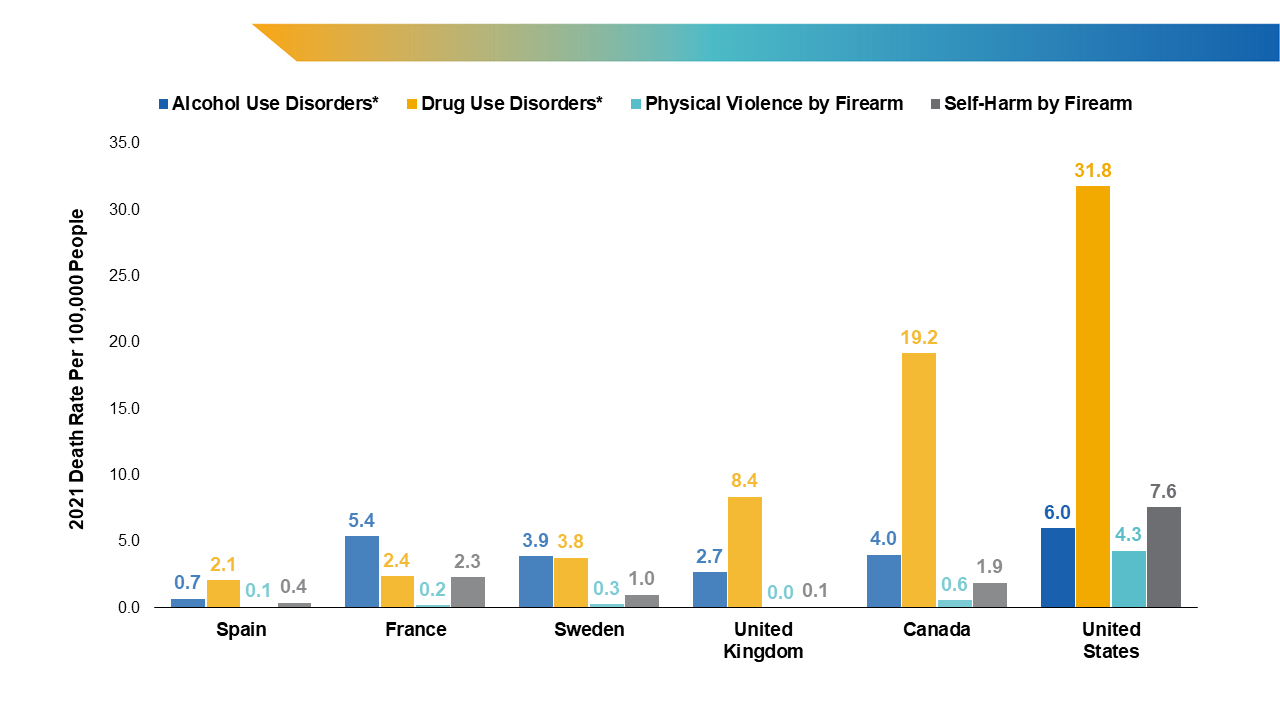
Figure 1. Death rates by cause of death.
* Drug use disorder deaths include all deaths by overdose of commonly misused drugs, and alcohol use disorder deaths include alcohol-induced deaths. Definitions of causes of death vary by country, see original source for more information.
Source: World Health Organization, the Global Health Observatory. Global health estimates: leading causes of death. Accessed September 12, 2024. https://www.who.int/data/gho/data/themes/mortality-and-global-health-estimates/ghe-leading-causes-of-death; Institute for Health Metrics and Evaluation, Global Health Data Exchange. Global Burden of Death Study 2021 results. Accessed September 12, 2024. https://vizhub.healthdata.org/gbd-results/
Image Description
Opportunities to Add Potential Years of Life
In 2022, drug-related deaths accounted for the greatest loss of potential years of life expectancy at birth. In other words, if drug-related deaths did not occur, the average American could expect to live nearly one year longer (0.9 years). The United States would add an average of 0.4 years and 0.3 years of life expectancy if firearm-related and alcohol-induced deaths, respectively, were eliminated (Figure 2). Younger Americans would see the greatest opportunity for gaining potential years of life if these causes of death were eliminated, though each age group would be impacted to some degree if deaths due to alcohol, drugs, or firearms were eliminated or reduced.
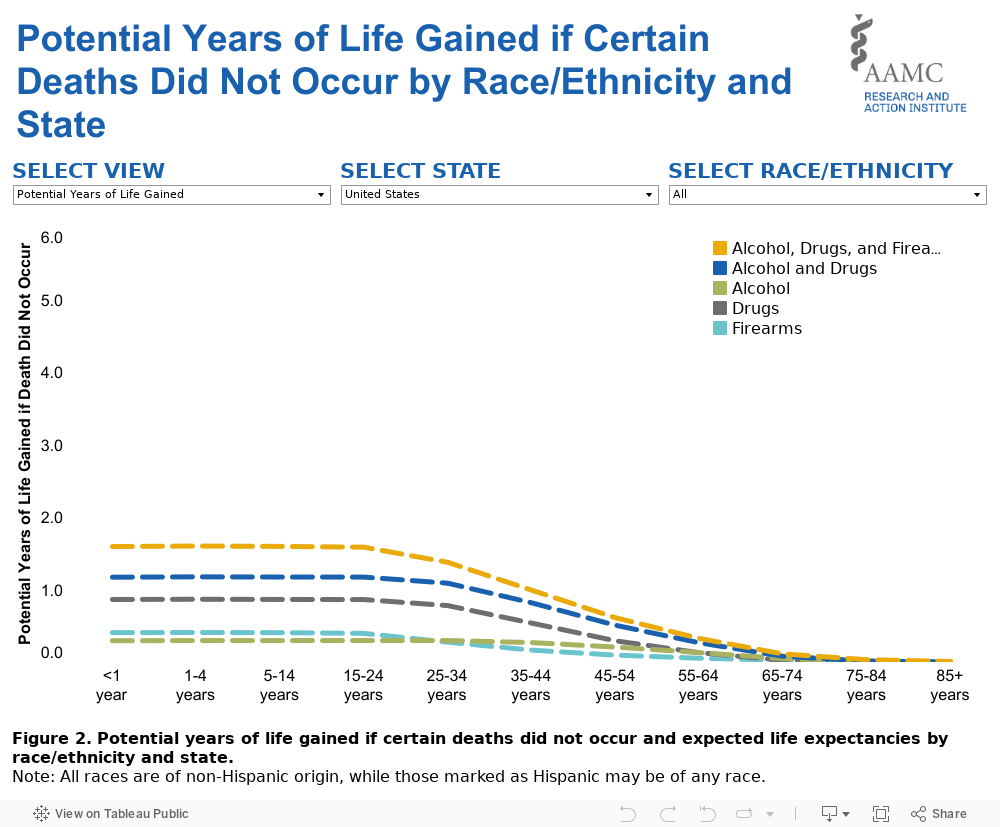
In addition, certain states would see a greater impact from eliminating these causes of death than others. For example, in West Virginia, Delaware, and Washington, D.C., the greatest increase in life expectancy (1.4 years) could be gained solely by eliminating deaths due to drugs. In New Mexico, Alaska, and South Dakota, focusing on alcohol would yield the greatest increase in life expectancy. In Louisiana, Mississippi, and New Mexico, residents would see the largest gains in life expectancy by eliminating deaths due to firearms. Overall, the potential years of life gained from eliminating all three of these causes of death are the largest in New Mexico, West Virginia, Alaska, Louisiana, and Washington, D.C. Overall, 10 states and the District of Columbia would see a jump of at least two years in life expectancy if deaths due to alcohol, drugs, and firearms did not occur, ranging from 2.0 years in South Carolina to 3.0 years in New Mexico.
Certain racial and ethnic groups in each state would also see dramatic increases in life expectancy if these deaths did not occur. Across the country, American Indian, Alaska Native, Black, White, and Hispanic populations would see the largest increases in life expectancy if alcohol-induced and drug- and firearm-related deaths were eliminated; Asian populations would only see minimal increases, and Native Hawaiian and other Pacific Islander populations would not see any impact on life expectancy. While the differences in potential years of life gained occur by race and ethnicity, this analysis does not examine how the many social and economic factors impact life expectancy across these groups.23
- Hill L, Artiga S. What is driving widening racial disparities in life expectancy? KFF. Published May 23, 2023. Accessed September 16, 2024. https://www.kff.org/racial-equity-and-health-policy/issue-brief/what-is-driving-widening-racial-disparities-in-life-expectancy/ Back to text ↑
Collective Policy Can Close the Gap
Achieving zero deaths due to alcohol, drugs, and firearms is highly unlikely in the United States or elsewhere in the world. Nonetheless, federal and state policies can help decrease these deaths and improve life expectancy for all. Reducing causes of death that disproportionately impact children and young people is particularly important, since youth death rates have the greatest impact on the nation’s average life expectancy. Even a slight reduction in deaths due to the three causes listed above would bring the United States’ life expectancy at birth closer to the OECD average (Figure 3).
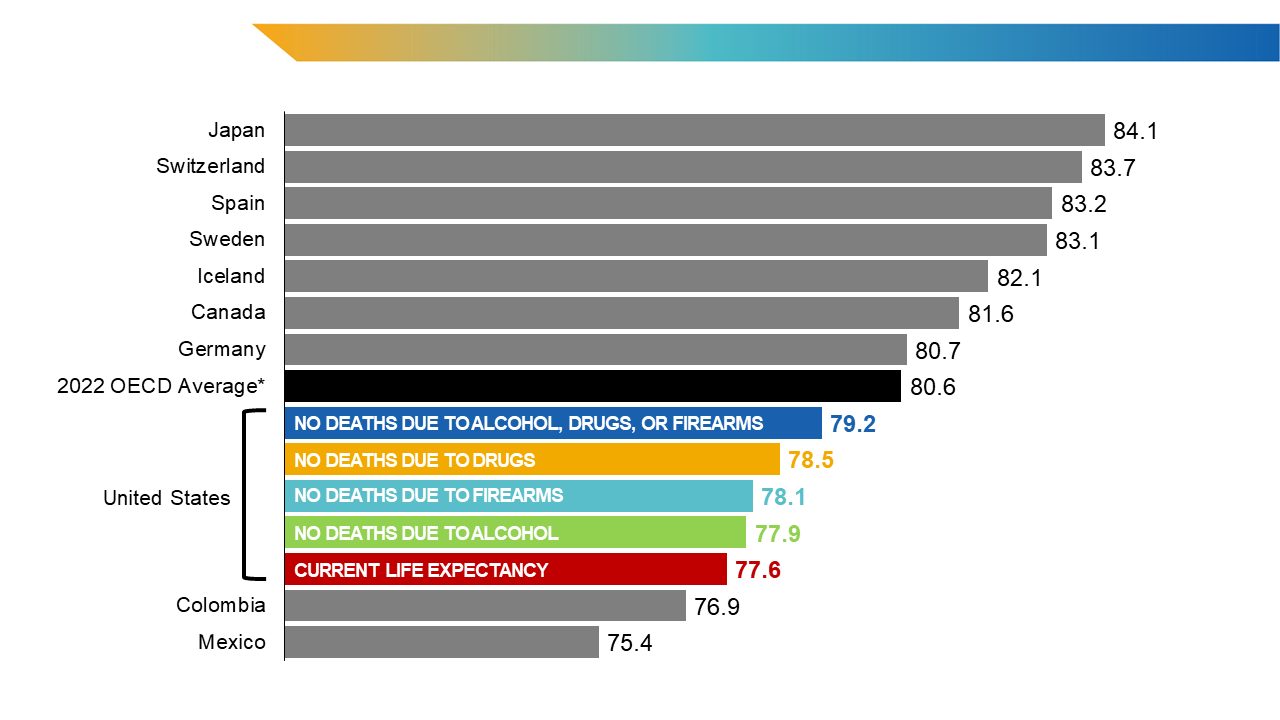
Figure 3. International life expectancy comparison if deaths due to alcohol, drugs, or firearms did not occur in the United States.
Values for Canada and Mexico are from 2021; the overall Organization for Economic Cooperation and Development (OECD) average includes 2022 values or those from the most recent year of data available; all other countries are listed with 2022 values. Life expectancy for countries other than the United States include all causes of death.
Source: CDC, National Center for Health Statistics. CDC Wonder. Underlying cause of death, 2018-2022, single race request. Accessed September 16, 2024. http://wonder.cdc.gov/ucd-icd10-expanded.html; OECD. Life expectancy at birth. In: Health at a Glance 2023: OECD Indicators. OECD Publishing; 2023. doi:10.1787/d90b402d-en
Findings from this analysis highlight that the United States’ lower life expectancy is impacted by three causes of death that are amenable to policy interventions at the national and state levels. If researchers and policymakers believe that life expectancy is a primary measure of a nation’s health, immediate gains are likely to be achieved through targeted efforts affecting these three major causes of death.
The United States has successfully reduced car crash deaths, beginning in the 1970s, by instituting seatbelt laws, drunk driving awareness campaigns, changes in the engineering of cars, and other interventions.24 25 Similar interventions have been proven to be effective for helping to reduce alcohol and substance use, firearm injury, and suicide rates, ranging from access to treatment for mental health and substance use disorders, to policy measures (like firearm safe storage laws26 27 and limitations on hours of alcohol sale 28 ), to enhancement of community mentoring programs29 30 and installment of gardens and green space.31 32 33 Collectively, these interventions and others have potentially large effects on all firearm- and drug-related and alcohol-induced causes of death that contribute to decreased life expectancy. U.S. policymakers and community members with the goal of improving life expectancy at birth should consider federal, state, and international examples of investments to help minimize these and other preventable causes of death across the country.
- U.S. Dept of Transportation, National Highway Traffic Safety Administration. Traffic Safety Facts: Early Estimate of Motor Vehicle Traffic Fatalities in 2023. Published April 2024. Accessed September 16, 2024. https://crashstats.nhtsa.dot.gov/Api/Public/ViewPublication/813561 Back to text ↑
- CDC. Achievements in public health, 1900-1999 motor-vehicle safety: a 20th century public health achievement. MMWR Morb Mortal Wkly Rep. 1999;48(18):369-374. https://www.cdc.gov/mmwr/preview/mmwrhtml/mm4818a1.htm Back to text ↑
- RAND Corporation. How do state laws affect firearm deaths? Accessed September 16, 2024. https://www.rand.org/research/gun-policy/firearm-law-effects.html Back to text ↑
- Schell TL, Smart R, Cefalu M, Griffin BA, Morral AR. State policies regulating firearms and changes in firearm mortality. JAMA Netw Open. 2024;7(7):e2422948. doi:10.1001/jamanetworkopen.2024.22948 Back to text ↑
- Trangenstein PJ, Eck RH, Lu Y, et al. The violence prevention potential of reducing alcohol outlet access in Baltimore, Maryland. J Stud Alcohol Drugs. 2020;81(1):24-33. doi:10.15288/jsad.2020.81.24 Back to text ↑
- Dubois D, Herrera C, Rivera J, Brechling V, Root S. Randomized Controlled Trial of the Effects of the Big Brothers Big Sisters Community-Based Mentoring Program on Crime and Delinquency: Interim Report of Findings. September 2022. University of Illinois at Chicago. Report. doi:10.25417/uic.20767438.v1 Back to text ↑
- DuBois, DL, Herrera C, Rivera J. Investigation of long-term effects of the Big Brothers Big Sisters Community-Based Mentoring Program: Final Technical Report for [Office of Juvenile Justice and Delinquency Prevention (OJJDP)]. OJJDP, Office of Justice Programs, U.S. Dept of Justice; 2018. Accessed September 16, 2024. https://www.ojp.gov/pdffiles1/ojjdp/grants/251521.pdf Back to text ↑
- Rojas-Rueda D, Nieuwenhuijsen MJ, Gascon M, Perez-Leon D, Mudu P. Green spaces and mortality: a systematic review and meta-analysis of cohort studies. Lancet Planet Health. 2019;3(11):e469-e477. doi:10.1016/S2542-5196(19)30215-3 Back to text ↑
- Almog S, Scaglione NM, Cheong J, Rung JM, Vásquez Ferreiro A, Berry MS. Spending time in nature serves as a protective factor against problematic alcohol use: a structural equation modeling approach. Int J Environ Res Public Health. 2022;19(20):13356. doi:10.3390/ijerph192013356 Back to text ↑
- Branas CC, South E, Kondo MC, et al. Citywide cluster randomized trial to restore blighted vacant land and its effects on violence, crime, and fear. Proc Natl Acad Sci U S A. 2018;115(12) 2946-2951. doi: 10.1073/pnas.1718503115 Back to text ↑
Methods
The numbers of deaths and population sizes were sourced from the CDC WONDER online database, “About Underlying Cause of Death, 2018-2022, Single Race.” Data are from the Multiple Cause of Death files (2018-2022), as compiled from data provided by the 57 vital statistics jurisdictions through the Vital Statistics Cooperative Program, maintained by the National Center for Health Statistics.34 Table 1 lists the ICD-10 codes utilized to determine deaths due to drugs, firearms, and alcohol.
- CDC. Wonder.cdc.gov. Accessed September 13, 2024. http://wonder.cdc.gov/ucd-icd10-expanded.html Back to text ↑
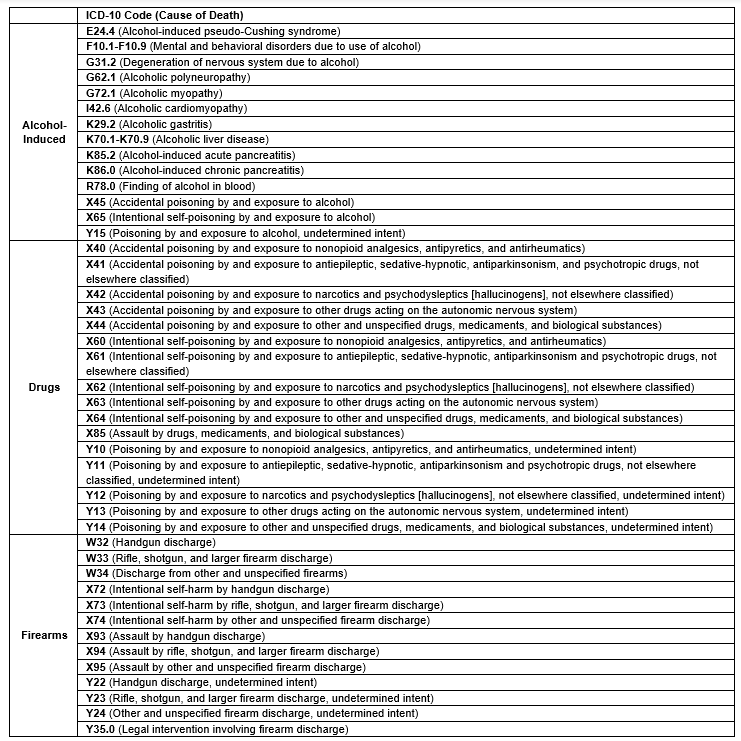
Table 1. Alcohol-Induced and Drug- and Firearm-Related Deaths by ICD-10 Codes.
Source: KFF. State health facts. Accessed September 13, 2024. https://www.kff.org/statedata/
These data were then used to calculate life expectancies using the County Health Rankings & Roadmaps mortality calculator.35 R statistical software was used to automate the formulas to calculate life expectancy across all race or ethnicity and age groups for each cause of death. In the analyses, all races are of non-Hispanic origin, while those marked as Hispanic may be of any race.
- County Health Rankings & Roadmaps. Mortality calculator. Accessed September 13, 2025. https://www.countyhealthrankings.org/sites/default/files/media/document/CHRR%20Mortality%20Calculator%20v2_0.xlsx Back to text ↑