Figure 1
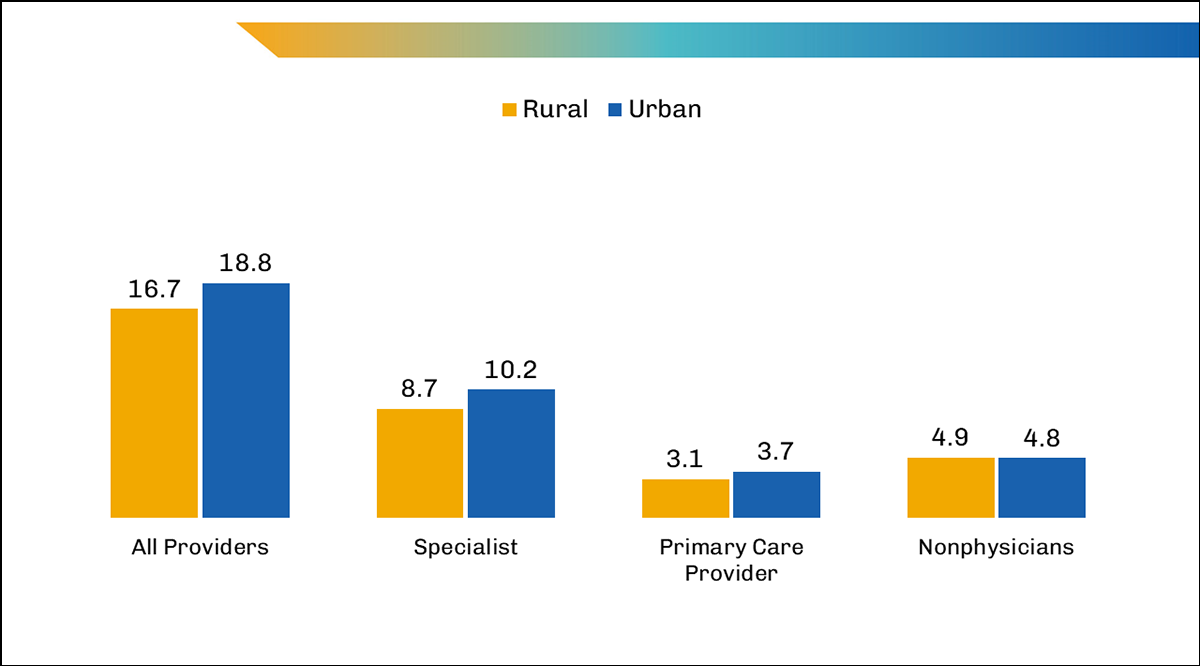
Figure 1. Average number of claims per fee-for-service Medicare beneficiary by provider type and rurality, 2021.
Note: Primary Care Provider includes the following specialties: general practice, family practice, internal medicine, pediatric medicine, geriatric medicine, and preventive medicine. Values may not sum to total due to rounding.
Overview
The figure shows the average number of claims per fee-for-service Medicare beneficiary by provider type and rurality in 2021. It shows that the average number of claims per fee-for-service beneficiary across all provider types in both rural and urban areas were similar. From left to right, provider types are All Providers, Specialists, Primary Care Provider, and Nonphysicians. The largest difference in average number of claims per beneficiary by rurality is Specialists, while the smallest difference is Nonphysicians.
Values
| Provider Type | All Providers | Specialist | Primary Care Provider | Nonphysicians |
|---|---|---|---|---|
| Rural | 16.7 | 8.7 | 3.1 | 4.9 |
| Urban | 18.8 | 10.2 | 3.7 | 4.8 |
Presentation
The bar chart includes provider type, and rurality, and the average number of claims per fee-for-service Medicare beneficiary. Provider type is represented on the x-axis, listed horizontally from left to right. Rurality is represented by bars lined up horizontally and designated by color: Rural (gold) and Urban (blue). The average number of claims per beneficiary is represented at the top of each bar.
Figure 2
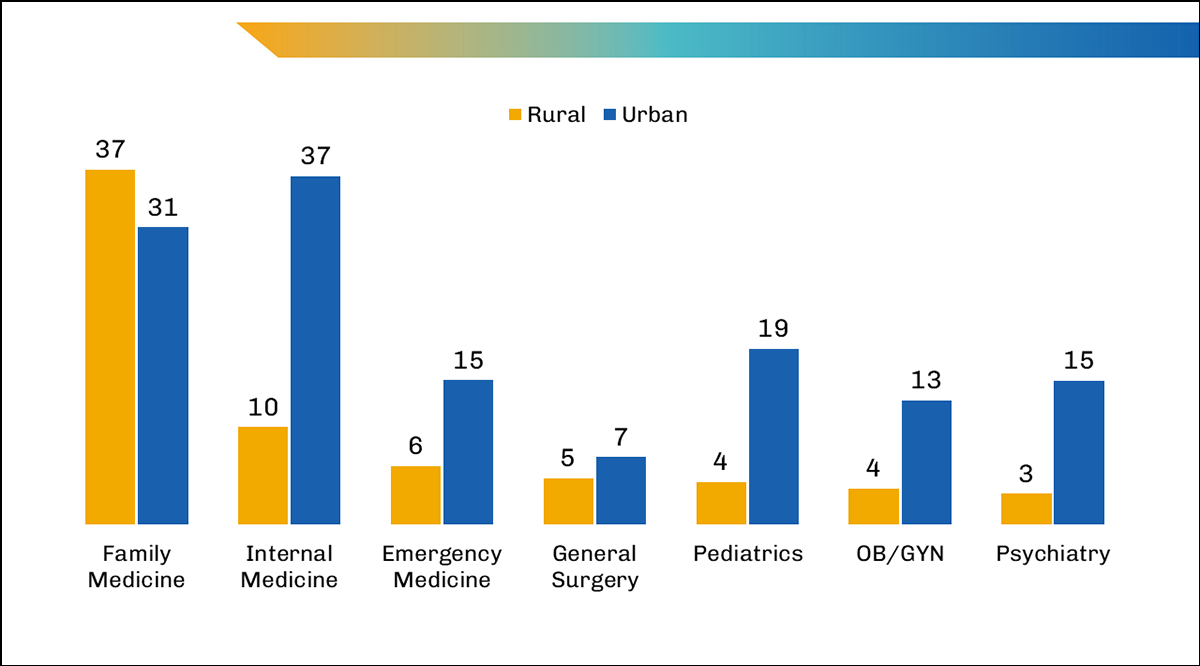
Figure 2: Number of physicians per 100,000 population by specialty, 2022.
Overview
The figure shows the number of physicians per 100,000 population by specialty in 2022 by rurality. It shows that across all but one specialty, urban areas have a higher number of physicians per 100,000 population than rural areas. From left to right, specialties are Family Medicine, Internal Medicine, Emergency Medicine, General Surgery, Pediatrics, OB/GYN, and Psychiatry. In contrast, Family Medicine has more physicians in rural areas than urban areas.
Values
| Specialty type | Family Medicine | Internal Medicine | Emergency Medicine | General Surgery | Pediatrics | OB/GYN | Psychiatry |
|---|---|---|---|---|---|---|---|
| Rural | 37 | 10 | 6 | 5 | 4 | 4 | 3 |
| Urban | 31 | 37 | 15 | 7 | 19 | 13 | 15 |
Presentation
The bar chart includes specialty type, rurality, and the number of physicians per 100,000 population. Specialty type is represented on the x-axis, listed horizontally from left to right. Rurality is represented by bars lined up horizontally and designated by color: Rural (gold) and Urban (blue). The number of physicians per 100,000 population is represented at the top of each bar.