Figure 1
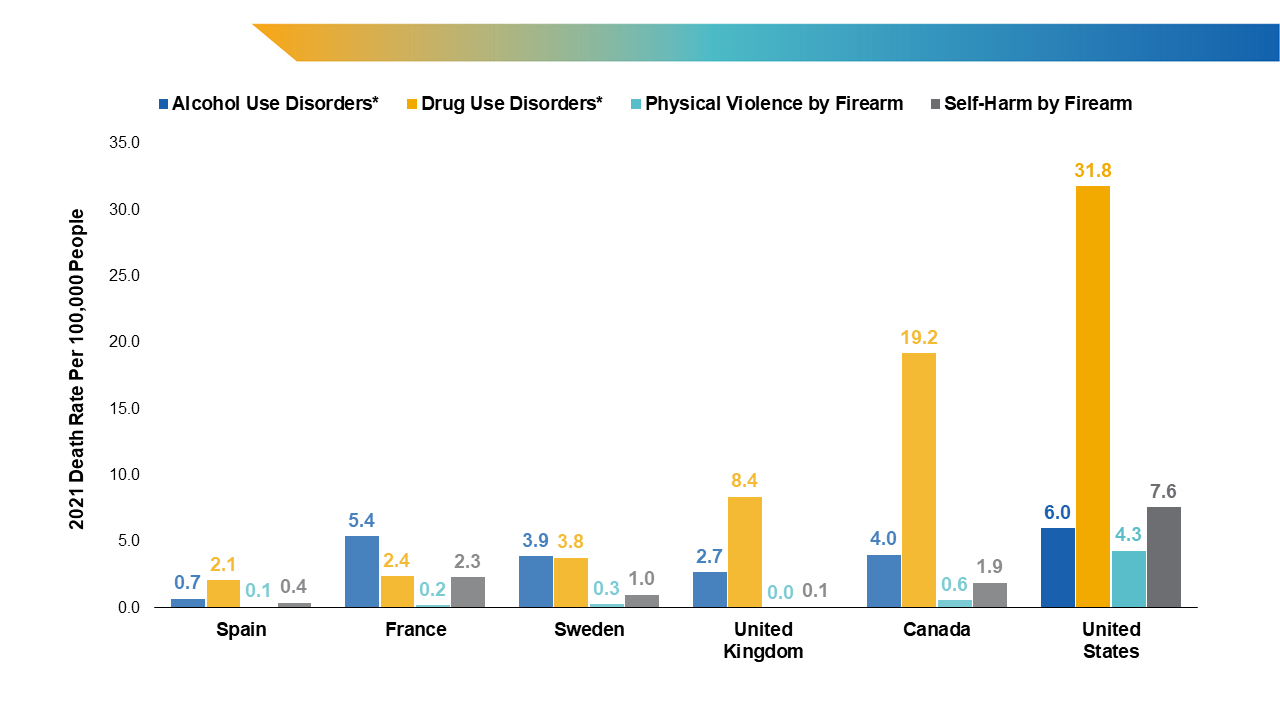
Figure 1. Death rates by cause of death.
* Drug use disorder deaths include all deaths by overdose of commonly misused drugs, and alcohol use disorder deaths include alcohol-induced deaths. Definitions of causes of death vary by country, see original source for more information.
World Health Organization, the Global Health Observatory. Global health estimates: leading causes of death. Accessed September 12, 2024. https://www.who.int/data/gho/data/themes/mortality-and-global-health-estimates/ghe-leading-causes-of-death; Institute for Health Metrics and Evaluation, Global Health Data Exchange. Global Burden of Death Study 2021 results. Accessed September 12, 2024. https://vizhub.healthdata.org/gbd-results/
Overview
The figure contains a bar chart that shows the death rates per 100,000 people by cause of death across seven Organization for Economic Cooperation and Development (OECD) countries in 2021. It shows that across the six comparable OECD countries of Spain, France, Sweden, Australia, the United Kingdom, and Canada, the United States has had disproportionately higher death rates from alcohol use disorders, drug use disorders, physician violence by firearm, and self-harm by firearm.
Values
| Spain | France | Sweden | United Kingdom | Canada | United States | |
|---|---|---|---|---|---|---|
| Alcohol Use Disorders |
0.7 |
5.4 |
3.9 |
2.7 |
4.0 |
6.0 |
| Drug Use Disorders |
2.1 |
2.4 |
3.8 |
8.4 |
19.2 |
31.8 |
| Physical Violence by Firearm |
0.1 |
0.2 |
0.3 |
0.0 |
0.6 |
4.3 |
| Self-Harm by Firearm |
0.4 |
2.3 |
1.0 |
0.1 |
1.9 |
7.6 |
Presentation
The bar chart represents the death rates per 100,000 people by cause of death across six Organization for Economic Cooperation and Development (OECD) countries in 2021. The x-axis represents the six OECD countries from left to right: Spain, France, Sweden, United Kingdom, Canada, and United States. The y-axis represents 2021 death rate per 100,000 people, ranging from 0.0 to 35.0. The 2021 death rate per 100,000 people is represented at the top of each bar by OECD country. Cause of death is represented for each country is represented by color from left to right: Alcohol Use Disorder (blue), Drug Use Disorder (gold), Physical Violence by Firearm (teal), and Self-Harm by Firearm (gray).
Figure 2
Overview
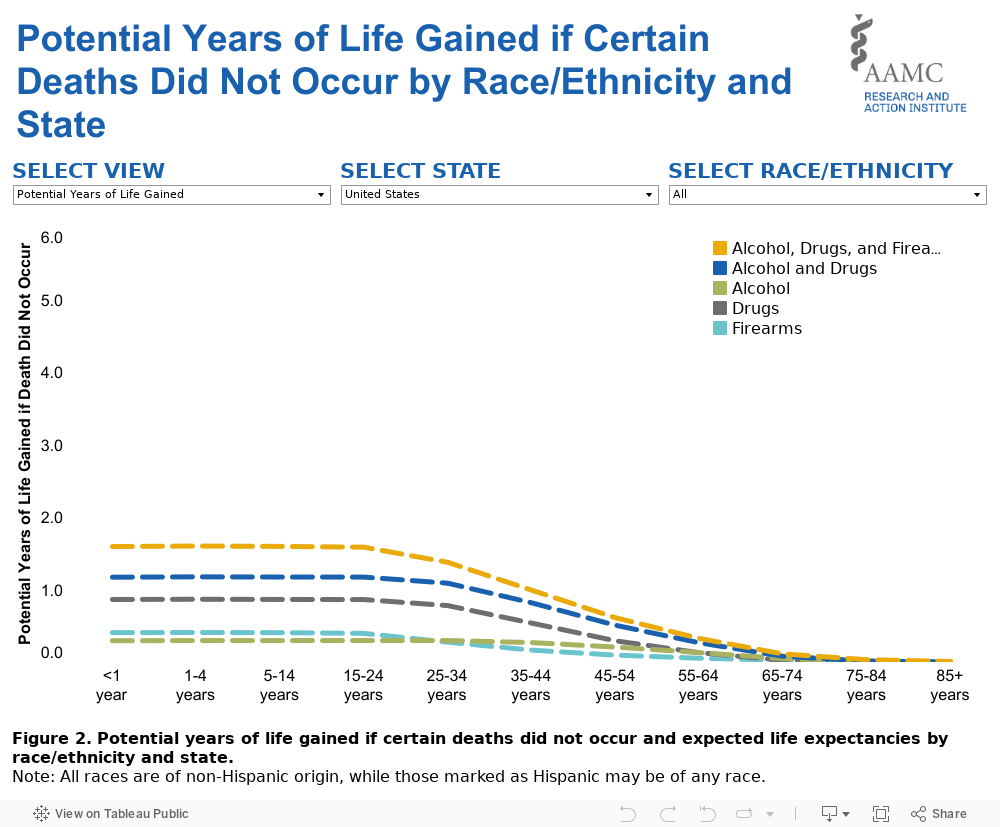
The figure contains a line graph that shows the potential years of life gained if certain deaths did not occur by age group in the United States and contains the option to search by state and race/ethnicity. It shows that the United States could gain the largest potential years of life expectancy if deaths due to alcohol, drugs, and firearms did not occur. If drug-related deaths did not occur, the United States could gain an average of 0.9 years at birth; if firearm-related and alcohol-induced deaths did not occur, the United States could gain 0.4 years and 0.3 years of life expectancy, respectively.
Values
| <1 year | 1-4 years | 5-14 years | 15-24 years | 25-34 years | 35-44 years | 35-44 years | 45-54 years | 55-64 years | 65-74 years | 85+ | |
|---|---|---|---|---|---|---|---|---|---|---|---|
| Alcohol, Drugs, and Firearms |
1.6 |
1.6 |
1.6 |
1.6 |
1.4 |
1.0 |
0.6 |
0.3 |
0.1 |
0.0 |
0.0 |
| Alcohol and Drugs |
1.2 |
1.2 |
1.2 |
1.2 |
1.1 |
0.8 |
0.5 |
0.3 |
0.1 |
0.0 |
0.0 |
| Alcohol |
0.3 |
0.3 |
0.3 |
0.3 |
0.3 |
0.3 |
0.2 |
0.1 |
0.1 |
0.0 |
0.0 |
| Drugs |
0.9 |
0.9 |
0.9 |
0.9 |
0.8 |
0.5 |
0.3 |
0.1 |
0.0 |
0.0 |
0.0 |
| Firearms |
0.4 |
0.4 |
0.4 |
0.4 |
0.3 |
0.2 |
0.1 |
0.1 |
0.0 |
0.0 |
0.0 |
Presentation
The line graph represents the potential years of life gained if certain deaths did not occur by age group and by all races/ethnicities in the United States. The x-axis represents age group of Americans from left to right: <1 year, 1-4 years, 5-14 years, 15-24 years, 25-34 years, 35-44 years, 45-54 years, 55-64 years, 65-74 years, 75-84 years, 85+ years. The y-axis represents potential years of life gained, ranging from 0.0 to 6.0. Type of death is represented in each dotted line by color: Alcohol, Drugs, and Firearms (gold), Alcohol and Drugs (blue), Alcohol (green), Drugs (gray), and Firearms (teal).
Figure 3
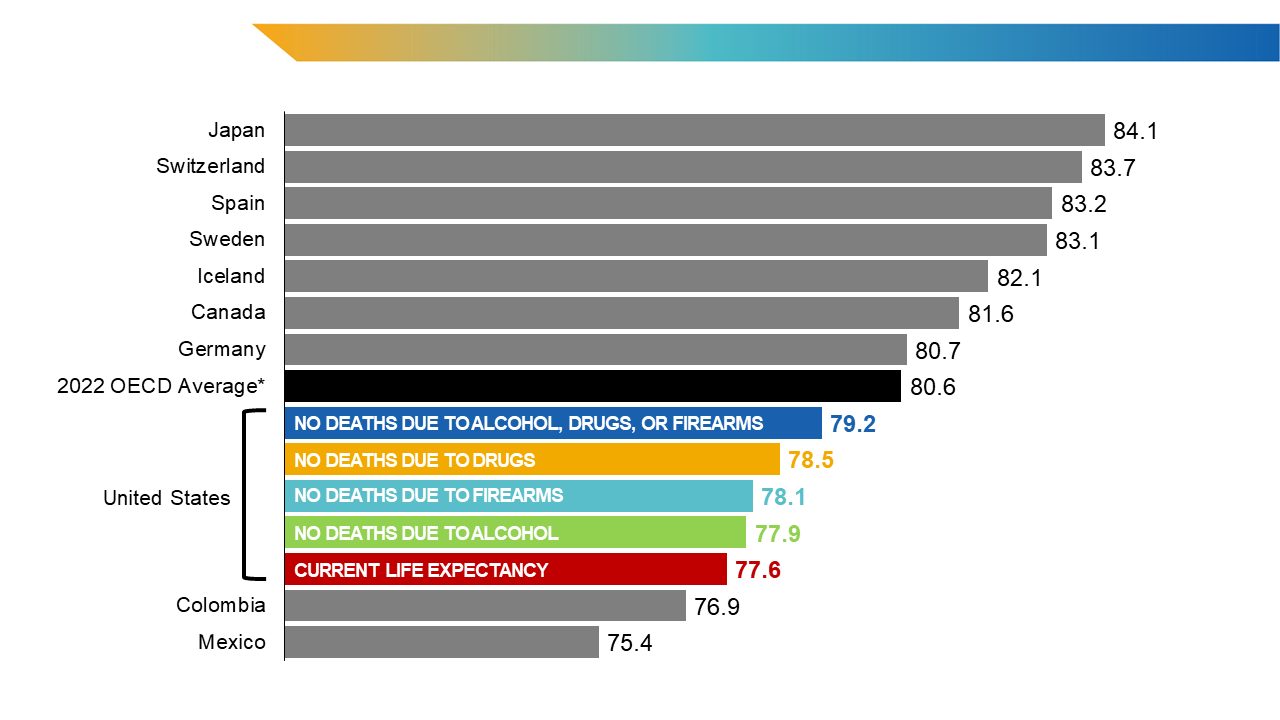
Figure 3. International life expectancy comparison if deaths due to alcohol, drugs, or firearms did not occur in the United States.
Values for Canada and Mexico are from 2021; the overall Organization for Economic Cooperation and Development (OECD) average includes 2022 values or those from the most recent year of data available; all other countries are listed with 2022 values. Life expectancy for countries other than the United States include all causes of death.
Source: CDC, National Center for Health Statistics. CDC Wonder. Underlying cause of death, 2018-2022, single race request. Accessed September 16, 2024. http://wonder.cdc.gov/ucd-icd10-expanded.html; OECD. Life expectancy at birth. In: Health at a Glance 2023: OECD Indicators. OECD Publishing; 2023. doi:10.1787/d90b402d-en
Overview
The figure contains a bar chart that shows international life expectancies compared to the United States’ current life expectancy and potential life expectancy if deaths due to alcohol, drugs, firearms, and if the combination of all three did not occur. It shows that if deaths due to alcohol, drugs, or firearms, did not occur in the United States, life expectancy would increase to values closer to the 2022 Organization for Economic Cooperation and Development (OECD) average.
Values
|
Japan |
84.1 |
|
Switzerland |
83.7 |
|
Spain |
83.2 |
|
Sweden |
83.1 |
|
Iceland |
82.1 |
|
Canada |
81.6 |
|
Germany |
80.7 |
|
2022 OECD Average |
80.6 |
|
United States - No Deaths Due to Alcohol, Drugs, or Firearms |
79.2 |
|
United States - No Deaths Due to Drugs |
78.5 |
|
United States - No Deaths Due to Firearms |
78.1 |
|
United States - No Deaths Due to Alcohol |
77.9 |
|
United States - Current Life Expectancy |
77.6 |
|
Colombia |
76.9 |
|
Mexico |
75.4 |
Presentation
The bar chart represents international life expectancies compared to the United States’ current life expectancy and potential life expectancy if deaths due to alcohol, drugs, firearms, and the combination of all three did not occur. The x-axis represents the life expectancy in years, ranging from 75.4 to 84.1 years. The y-axis represents Organization for Economic Cooperation and Development (OECD) countries including the United States, and the United States’ if certain deaths did not occur in from top to bottom: Japan, Switzerland, Spain, Sweden, Iceland, Canada, Germany, 2022 OECD average, United States with No Deaths Due to Alcohol, Drugs, or Firearms, United States with No Deaths Due to Drugs, United States with No Deaths Due to Firearms, United States with No Deaths Due to Alcohol, United States’ current life expectancy, Colombia, and Mexico. Bars differentiating the 2022 OECD average life expectancy and life expectancy in the United States are represented by color: 2022 OECD average (black), United States - No Deaths Due to Alcohol, Drugs, or Firearms (blue), United States - No Deaths Due to Drugs (gold), United States - No Deaths Due to Firearms (teal), United States - No Deaths Due to Alcohol (green), United States - Current Life Expectancy (red); and bars representing other countries (gray).