Figure 1

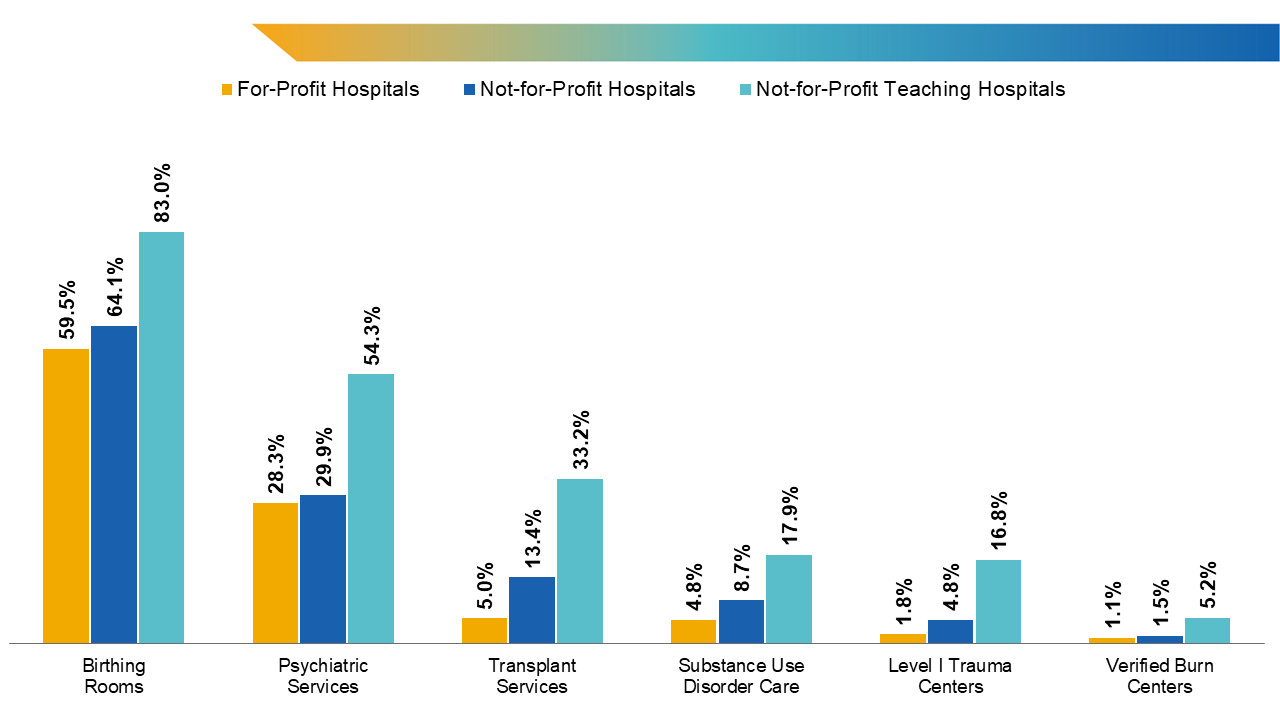
Figure 1. Share of general, acute care hospitals offering services by ownership type. Note: Hospitals designated as “church”; “state government”; and other, not-for-profit ownership types were classified as not-for-profit institutions. Transplant services include bone marrow, heart, kidney, liver, lung, tissue, and/or other transplants.
Source: American Hospital Association Annual Survey Database for fiscal year 2022.
Overview
The figure contains a bar chart that compares the share of general, acute care hospitals offering services by ownership type in 2022. It shows that not-for-profit hospitals, and particularly not-for-profit teaching hospitals, were more likely than for-profit hospitals to offer a variety of clinical services, including those that are unprofitable.
Values
| Birthing Rooms | Psychiatric Services | Transplant Services | Substance Use Disorder Care | Level I Trauma Centers | Verified Burn Centers | |
|---|---|---|---|---|---|---|
| For-Profit Hospitals |
59.5% |
28.3% |
5.0% |
4.8% |
1.8% |
1.1% |
| Not-for-Profit Hospitals |
64.1% |
29.9% |
13.4% |
8.7% |
4.8% |
1.5% |
| Not-for-Profit Teaching Hospitals |
83.0% |
54.3% |
33.2% |
17.9% |
16.8% |
5.2% |
Presentation
The bar chart represents the differences in percentage share of general, acute care hospitals offering complex services by ownership type in 2022. The x-axis represents the service offering from left to right: Birthing Rooms, Psychiatric Services, Transplant Services, Substance Use and Disorder Care, Level I Trauma Centers, and Verified Burn Centers. Hospital ownership type is represented for each service offering by three colored bars from left to right: For-Profit Hospitals (gold), Not-for-Profit Hospitals (blue), and Not-for-Profit Teaching Hospitals (teal). The percentage share of hospitals offering a service by ownership is represented at the top of each colored bar.
Figure 2

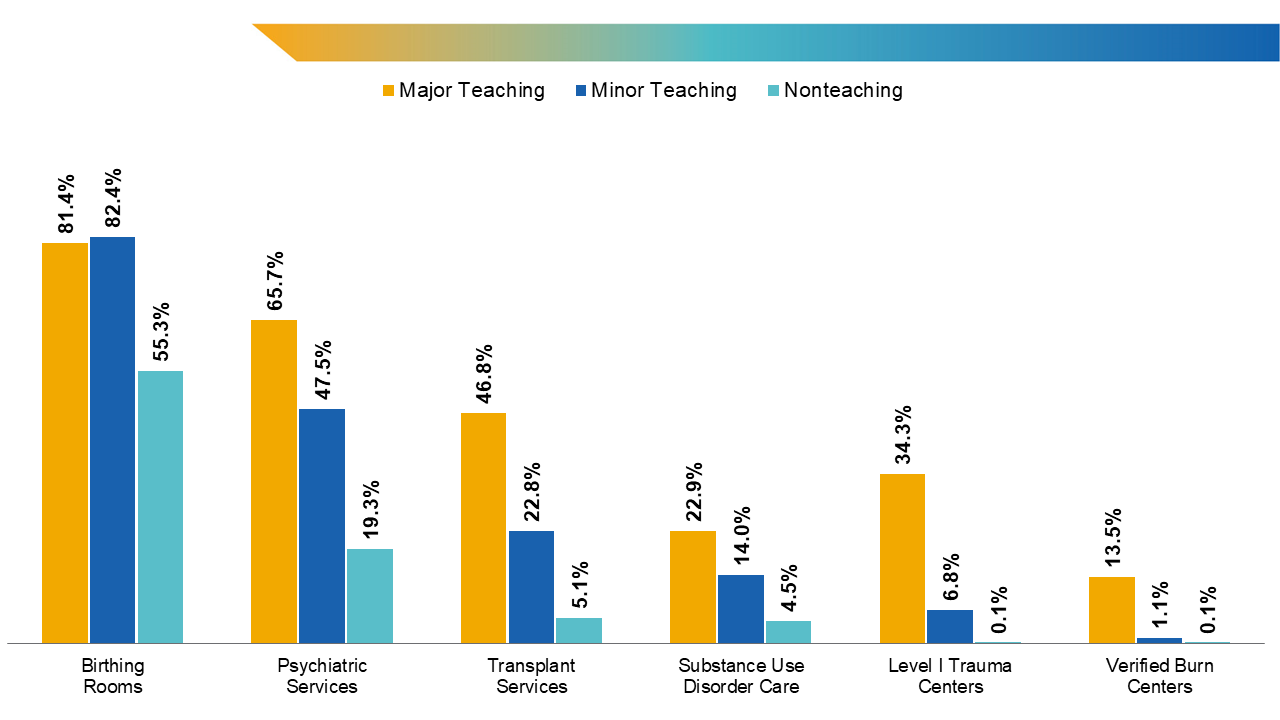
Figure 2. Share of general, acute care hospitals offering services by teaching status. Note: Major teaching hospitals were classified as having resident-to-bed ratios equal to or greater than 25%. Transplant services include bone marrow, heart, kidney, liver, lung, tissue, and/or other transplants.
Source: American Hospital Association Annual Survey Database for fiscal year 2022.
Overview
The figure contains a bar chart that compares the share of general, acute care hospitals offering services by teaching status in 2022. It shows that major teaching hospitals, followed closely by minor teaching hospitals, are more likely than nonteaching hospitals to offer complex services, including those that are less profitable.
Values
| Birthing Rooms | Psychiatric Services | Transplant Services | Substance Use Disorder Care | Level I Trauma Centers | Verified Burn Centers | |
|---|---|---|---|---|---|---|
| For-Profit Hospitals |
81.4% |
65.7% |
46.8% |
22.9% |
34.3% |
13.5% |
| Not-for-Profit Hospitals |
82.4% |
47.5% |
22.8% |
14.0% |
6.8% |
1.1% |
| Not-for-Profit Teaching Hospitals |
55.3% |
19.3% |
5.1% |
4.5% |
0.1% |
0.1% |
Presentation
The bar chart represents the differences in percentage share of general, acute care hospitals offering complex services by their teaching status in 2022. The x-axis represents the service offering from left to right: Birthing Rooms, Psychiatric Services, Transplant Services, Substance Use Disorder Care, Level I Trauma Centers, and Verified Burn Centers. Teaching status is represented for each service offering by three colored bars from left to right: Major Teaching (gold), Minor Teaching (blue), and Nonteaching (teal). The percentage share of hospitals offering a service by teaching status is represented at the top of each colored bar.
