The following figures provide data from States With Abortion Bans See Continued Decrease in U.S. MD Senior Residency Applicants, which was published by the AAMC Research Action Institute on May 9, 2024.
Figure 1
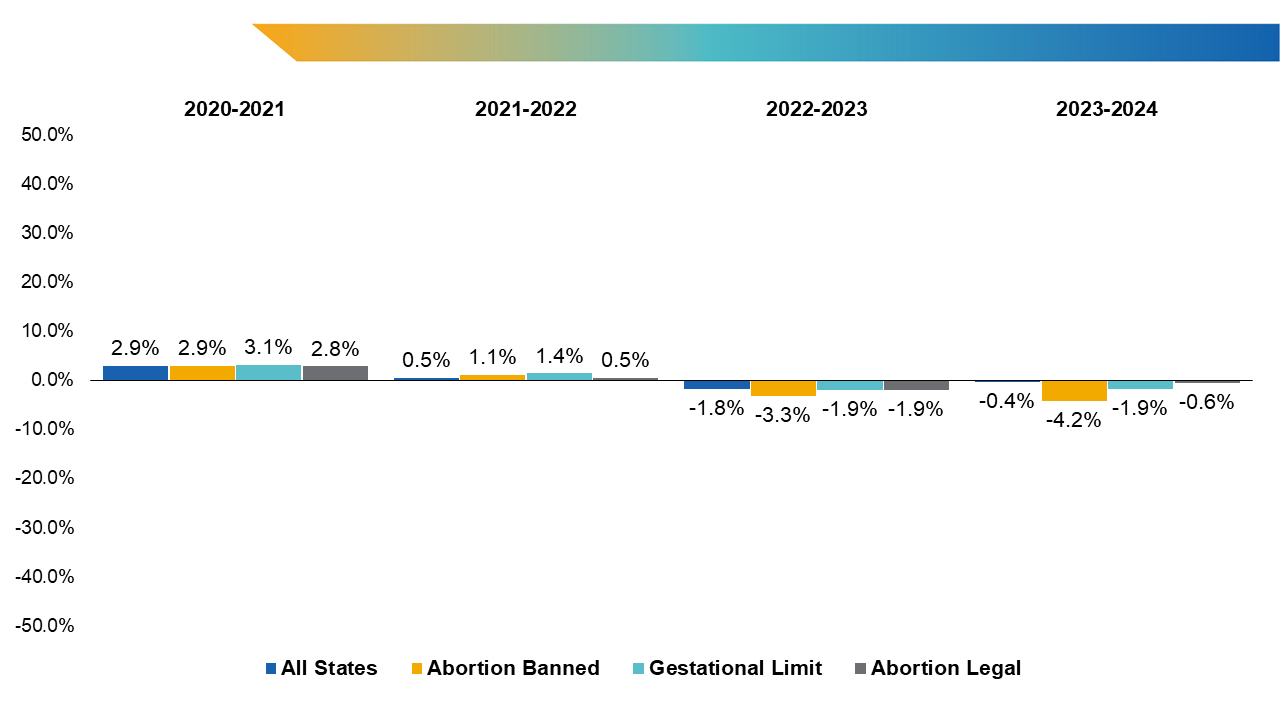
Figure 1. Note: State abortion ban status has been updated as of April 1, 2024, and will not be identical to previous publications.
Overview
The figure contains a bar chart showing the percent change in U.S. MD senior applicants from the previous application cycle from 2020 to 2024, along with the changes by state abortion status as of 2024 and specialty. It shows that from 2020-2022, the percent change in U.S. MD senior applicants across all specialties and by state abortion-ban status continued to increase overall, while from 2022-2024, the percent change in applicants across all specialties and state abortion-ban status continued to decrease. From 2022-2024, states with abortion bans show large decreases in U.S. MD senior applicants across all specialties compared to states with gestational limits or where abortion remains legal.
Values
| 2020-2021 | 2021-2022 | 2022-2023 | 2023-2024 | |
|---|---|---|---|---|
| All States | 2.9% | 0.5% | -1.8% | -0.4% |
| Abortion Banned | 2.9% | 1.1% | -3.3% | -4.2% |
| Gestational Limit | 3.1% | 1.4% | -1.9% | -1.9% |
| Abortion Legal | 2.8% | 0.5% | -1.9% | -0.6% |
Presentation
The bar chart represents the year-by-year percent change in U.S. MD senior applicants from the previous application cycle from 2020 to 2024 across all specialties and by state abortion status. The x-axis represents the application cycles (2020-2021, 2021-2022, 2022-2023, and 2023-2024) across state abortion ban statuses. The y-axis represents the percent change in U.S. MD senior applications across all specialties, ranging from -50% to 50%. Each application year contains four side-by-side bars in different colors that represent: All States (dark blue), Abortion Banned (gold), Gestational Limit (teal), and Abortion Legal (gray). The percent change in U.S. MD senior applicants across all specialties is represented at the top of each bar.
Figure 2
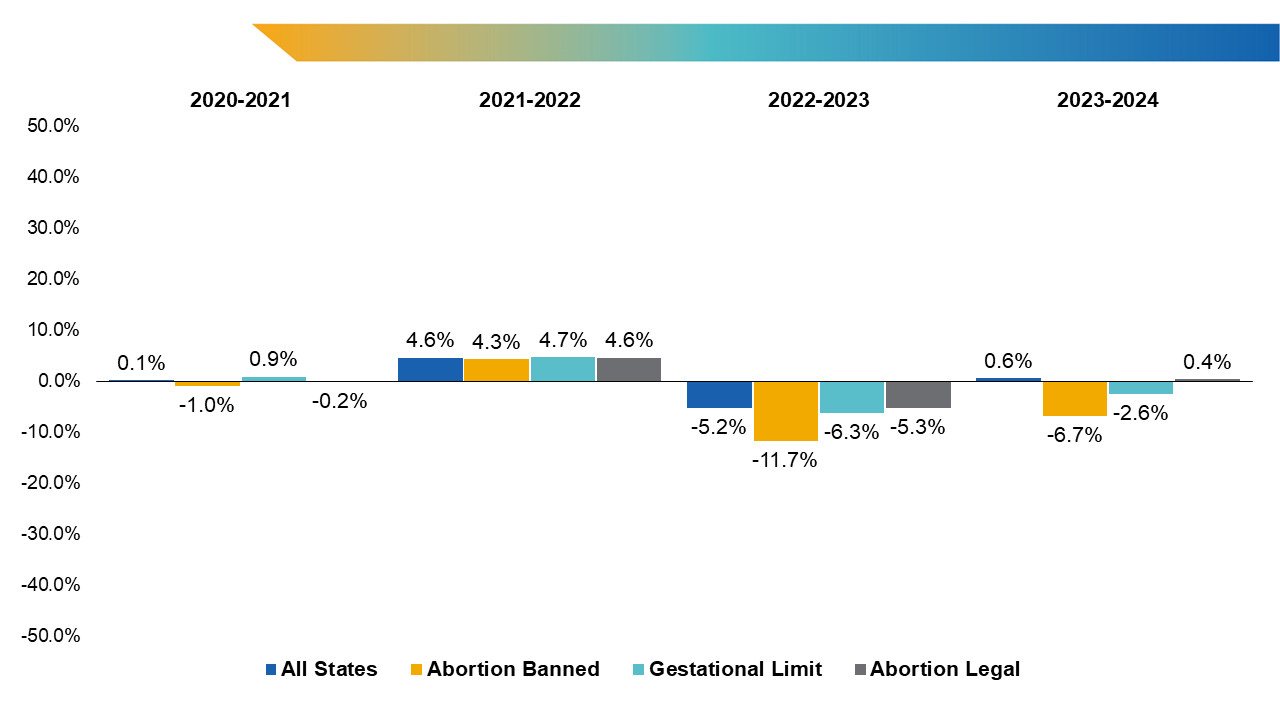
Figure 2. Percent change in U.S. MD senior OB/GYN applicants from the previous application cycle by state abortion-ban status. Note: State abortion ban status has been updated as of April 1, 2024, and will not be identical to previous publications.
Overview
The figure contains a bar chart that shows the percent change in U.S. MD senior OB/GYN applicants over the last four application cycles by year and state abortion ban status. It shows that from 2020-2021, the percent change in U.S. MD senior OB/GYN applicants by state abortion-ban status remains relatively small, with an increase in 2022. From 2023-2024, states with abortion bans show larger decreases compared to states with gestational limits or states where abortion remains legal. In 2024, states without restrictions show a small increase in percent change in U.S. MD senior OB/GYN applicants.
Values
| 2020-2021 | 2021-2022 | 2022-2023 | 2023-2024 | |
|---|---|---|---|---|
| All States | 0.1% | 4.6% | -5.2% | 0.6% |
| Abortion Banned | -0.1 | 4.3% | -11.7% | -6.7% |
| Gestational Limit | 0.9% | 4.7% | -6.3% | -2.6% |
| Abortion Legal | -0.2% | 4.6% | -5.3% | 0.4% |
Presentation
The bar chart represents the percent change in U.S. MD senior OB/GYN applicants from the previous application cycle from 2020-2024 by state abortion-ban status. The x-axis represents the application cycles (2020-2021, 2021-2022, 2022-2023, and 2023-2024) across state abortion ban statuses. The y-axis represents the percent change in U.S. MD senior OB/GYN applications across all specialties, ranging from -50% to 50%. Each application year contains four side-by-side bars in different colors that represent: All States (dark blue), Abortion Banned (gold), Gestational Limit (teal), and Abortion Legal (gray). The percent change in U.S. MD senior OB/GYN applicants is represented at the top of each bar.
Figure 3
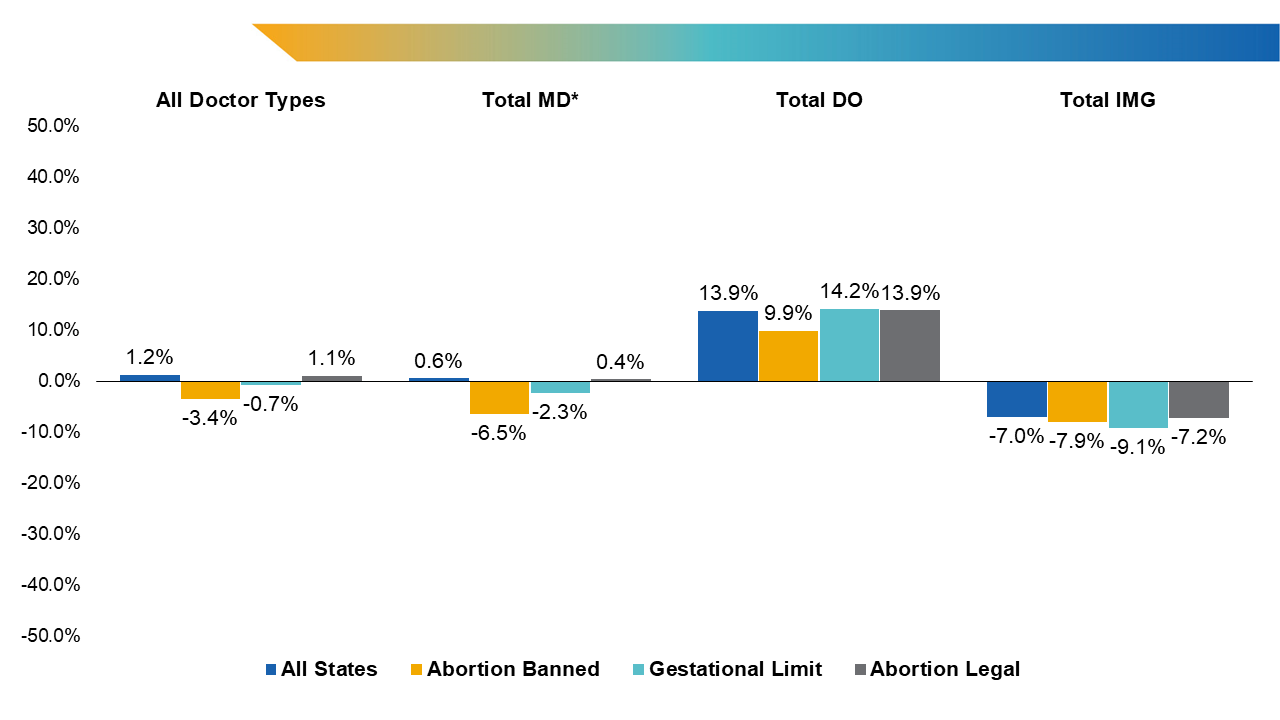
Figure 3. Percent change from 2023 to 2024 in OB/GYN applicants by graduate type and state abortion-ban status. *Includes seniors and previous medical school graduates.
Overview
The figure contains a bar chart that shows the percent change from 2023 to 2024 in OB/GYN applicants by graduate type and state abortion-ban status. It shows that the percent change in OB/GYN applicants across all graduate applicant types increased slightly in 2024 For all doctor types, there was an increase in applicants to OB/GYN residency programs in states where abortion is banned or limited, but it varied by doctor type and state abortion ban status. While DOs saw increases, IMGs saw decreases.
Values
| All Doctor Types | Total MD | Total DO | Total IMG | |
|---|---|---|---|---|
| All States | 1.2% | 0.6% | 13.9% | -7.0% |
| Abortion Banned | -3.4% | -6.5% | 9.9% | -7.9% |
| Gestational Limit | -0.7% | -2.3% | 14.2% | -9.1% |
| Abortion Legal | 1.1% | 0.4% | 13.9% | -7.2% |
Presentation
The bar chart represents the percent change from 2023 to 2024 in OB/GYN applicants by graduate type and state abortion-ban status. The x-axis represents the OB/GYN applicants by graduate type horizontally from left to right: All Doctor Types, Total M.D., Total DO, and Total IMG. The y-axis represents the percent change from 2023 to 2024 in OB/GYN applicants, ranging from –50% to 50%. Each of the doctor types contains four side-by-side bars in different colors that represent: All States (dark blue), Abortion Banned (gold), Gestational Limit (teal), and Abortion Legal (gray).